Is Delaware County the best New York county for your business?

Screenshot of report and Kristen, founder

Now you can skip hours of internet research and jump straight to getting answers with our meaningful at-a-glance Demographics by County Report. With the most current & most popular demographic data, it's the perfect starting point for your research about Delaware County and the rest of New York.

  • Don't waste 40 high-value hours searching the US Census Bureau site
  • Get up-to-date demographic data, ready to present or share
  • Spend more time using demographic data... and no time compiling it
  • Get an instant Demographics Report

We know Delaware County Demographics, just keep scrolling...

Delaware County Population

Sources: United States Census Bureau. 2022 American Community Survey 5-Year Estimates. U.S. Census Bureau, American Community Survey Office. Web. 7 December 2023.

United States Census Bureau. Annual Estimates of the Resident Population: April 1, 2020 to July 1, 2022. U.S. Census Bureau, Population Division. Web. May 2023. http://www.census.gov/.

United States Census Bureau. Annual Estimates of the Resident Population: April 1, 2010 to July 1, 2019. U.S. Census Bureau, Population Division. Web. May 2021. http://www.census.gov/.

United States Census Bureau. "P2 Hispanic or Latino, and Not Hispanic or Latino by Race." 2020 Census State Redistricting Data (Public Law 94-171) Summary File. U.S. Census Bureau, 2020 Census. Web. 12 August 2021. https://www.census.gov/.

Check out our FAQs for more details.

Delaware County Demographics Summary

population icon Population

With 44,637 people, Delaware County is the 53rd most populated county in the state of New York out of 62 counties. But watch out, Delaware County, because Wyoming County with 40,338 people and Orleans County with 40,148 people are right behind you.

race icon Race & Ethnicity

The largest Delaware County racial/ethnic groups are White (90.6%) followed by Hispanic (4.3%) and Two or More (2.5%).

income icon Median Income

In 2022, the median household income of Delaware County households was $58,338. Delaware County households made slightly more than Broome County households ($58,317) and Montgomery County households ($58,033) . However, 11.4% of Delaware County families live in poverty.

age icon Median Age

The median age for Delaware County residents is 48.9 years young.

FACT

86% of people CANNOT find the data they're looking for on the US Census Bureau website. Source: Nielsen Norman Group

We are CUBIT
We have 44+ years of experience and proprietary data-wrangling technology to research, download, format, analyze, visualize & cite the data you need.

Customer Quotes:

"Your starter report certainly saved me a considerable amount of time. I am just too busy to garner this needed data any other way. It truly would have taken hours of an employee's time or my own to get this much information. I was fortunate to find a company that had all the demographics that I needed and at a very reasonable price."

"My supervisor had assigned me the task of getting population data for the county for our required county education strategic plan. I had some information from Kids Count but need race, gender, age, etc. and the government census site was shutdown. I was so surprised to get a report within seconds and it had lots of charts and graphs that my supervisor liked."

Scroll for more
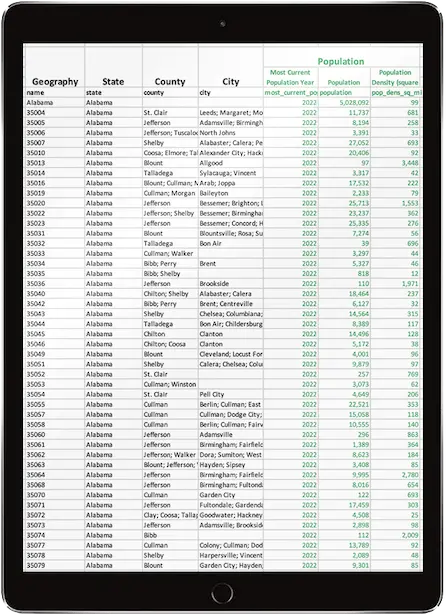
A B C D E F G H I J K L M N O P Q R S T U V W X Y Z AA AB AC AD AE AF AG AH AI AJ AK AL AM AN AO AP AQ AR AS AT AU AV AW AX AY AZ BA BB BC BD BE BF BG BH BI BJ BK BL BM BN BO BP BQ BR BS BT BU BV BW BX
1 Geography State County City Population Median Household Income Household Income Distribution Race & Ethnicity Age & Sex Median Age Educational Attainment Poverty Unemployment Housing Units Households Land Area (square meters) GEOID Population Percent Change Notes
Total Family and Non-family Households
Most Current Population Year Population Population Density
(square miles)
Total Female Male Total Occupied Units Families Married Couple Families Single Parent Families Non-families
Households Less than $25,000 $25,000 to $49,999 $50,000 to $74,999 $75,000 to $99,999 $100,000 to $149,999 $150,000 to $199,999 $200,000+ Total White Black Native Asian Islander Other Two or More Hispanic 0 to 9 Years 10 to 19 Years 20 to 29 Years 30 to 39 Years 40 to 49 Years 50 to 59 Years 60 to 69 Years 70+ Years 0 to 9 Years 10 to 19 Years 20 to 29 Years 30 to 39 Years 40 to 49 Years 50 to 59 Years 60 to 69 Years 70+ Years Population 25+ Years No Diploma High School Some College Bachelors Degree Graduate Degree Family Households Family Poverty Civilian Labor Force 16+ Years Unemployment Rate Occupied Owner-Occupied Renter-Occupied Median Value of Owner-Occupied Units Total With Own Children Under 18 Years Total With Own Children Under 18 Years 2000 2010 2020 2030 Projected 2000 to 2010 2010 to 2020 2020 to 2030
5 name state county city most_current_pop_year population pop_dens_sq_mi mhhi hhi_total_hh hhi_hh_w_lt_25k hhi_hh_w_25k_49k hhi_hh_w_50k_74k hhi_hh_w_75k_99k hhi_hh_w_100k_149k hhi_hh_w_150k_199k hhi_hh_w_200k_plus race_ethnicity_total race_ethnicity_white race_ethnicity_black race_ethnicity_native race_ethnicity_asian race_ethnicity_islander race_ethnicity_other race_ethnicity_two race_ethnicity_hispanic age_total age_f_0_9 age_f_10_19 age_f_20_29 age_f_30_39 age_f_40_49 age_f_50_59 age_f_60_69 age_f_70_plus age_m_0_9 age_m_10_19 age_m_20_29 age_m_30_39 age_m_40_49 age_m_50_59 age_m_60_69 age_m_70_plus median_age edu_att_pop_25_plus edu_att_no_diploma edu_att_high_school edu_att_some_college edu_att_bachelors edu_att_graduate family_hh_total family_poverty_pct emp_status_civ_labor_force unemployment_pct housing_units occupied_units owner_occupied renter_occupied median_value_owner_occupied_units households hh_families hh_mc_families hh_mc_with_own_children_under_18 hh_sp_families hh_sp_with_own_children_under_18 hh_non_families aland_sq_m geoid pop_2000 pop_2010 pop_2020 pop_2030 per_00_10 per_10_20 per_20_30 notes
16 Alabama Alabama 2022 5,028,092 99 $59,609 1,933,150 415,017 413,263 325,118 240,671 284,926 128,778 125,377 5,028,092 3,247,262 1,318,388 14,864 69,099 1,557 14,724 129,791 232,407 5,028,092 287,848 330,045 332,618 321,813 313,300 332,587 326,650 337,236 303,212 337,502 336,572 306,042 302,703 317,153 295,116 247,695 39 3,428,520 12% 30% 30% 16% 10% 1,255,864 11% 2,329,696 5% 2,296,920 1,933,150 1,347,792 585,358 $179,400 1,933,150 1,255,864 906,990 320,832 348,874 166,871 677,286 131,185,042,550 0400000US01 4,447,100 4,779,736 5,024,279 5,124,380 7% 5% 2%
17 Autauga County Alabama 2022 58,761 99 $68,315 22,308 4,007 4,286 3,648 3,225 3,961 1,525 1,656 58,761 42,635 11,496 59 636 0 141 1,930 1,864 58,761 3,101 4,327 3,600 3,666 4,408 4,077 3,127 3,792 3,583 3,973 3,716 4,055 3,563 4,014 3,053 2,706 39 40,188 9% 31% 29% 16% 12% 15,363 8% 27,163 3% 24,457 22,308 16,832 5,476 $191,800 22,308 15,363 11,889 5,027 3,474 1,495 6,945 1,539,631,461 0500000US01001 43,671 54,571 58,805 60,327 25% 8% 3%
18 Baldwin County Alabama 2022 233,420 147 $71,039 90,802 14,239 18,405 14,540 13,086 15,443 6,801 8,288 233,420 192,161 19,318 512 2,046 22 992 7,159 11,210 233,420 11,967 14,723 12,079 14,063 14,401 15,952 17,777 18,381 12,302 15,734 12,080 14,032 13,598 15,176 15,310 15,845 44 167,022 8% 27% 31% 20% 12% 61,277 7% 111,079 3% 125,113 90,802 70,708 20,094 $266,000 90,802 61,277 51,019 16,575 10,258 5,153 29,525 4,117,724,893 0500000US01003 140,415 182,265 231,767 261,777 30% 27% 13%
19 Barbour County Alabama 2022 24,877 28 $39,712 9,016 3,126 2,181 1,387 748 979 255 340 24,877 11,084 11,662 63 126 3 290 447 1,202 24,877 1,594 1,221 1,271 1,518 1,169 1,518 1,643 1,970 1,321 1,572 1,913 1,831 1,738 1,619 1,597 1,382 41 17,675 23% 36% 27% 6% 5% 5,722 21% 8,968 6% 11,673 9,016 5,858 3,158 $102,700 9,016 5,722 3,431 1,089 2,291 1,157 3,294 2,292,160,151 0500000US01005 29,038 27,457 25,223 24,288 -5% -8% -4%
20 Bibb County Alabama 2022 22,251 36 $50,669 7,216 1,998 1,564 1,226 1,067 891 219 251 22,251 16,520 4,598 15 69 0 17 382 650 22,251 1,327 1,171 1,228 1,289 1,248 1,274 1,475 1,342 1,268 1,439 1,582 1,687 2,034 1,500 1,293 1,094 40 15,925 21% 40% 27% 6% 4% 4,871 16% 9,028 9% 9,046 7,216 5,465 1,751 $120,100 7,216 4,871 3,617 1,069 1,254 587 2,345 1,612,188,713 0500000US01007 20,826 22,915 22,293 22,023 10% -3% -1%

YES! I want a Demographics By County Report for New York!

Prices start at just $74. Fill out our order form and receive your data as an instant download.

Every report comes with a 100% Money-Back Guarantee

If you are unhappy for any reason, we'll happily refund your money.

Buy Now

Connect

Cubit logo

© Copyright 2024 Cubit Planning, Inc.